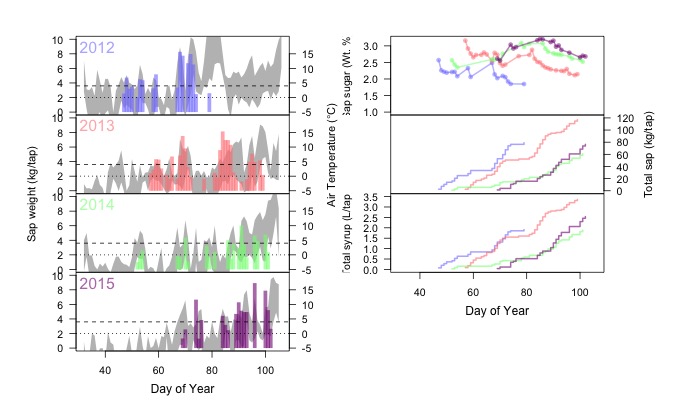
Tapping started about 3 weeks later than usual at Harvard Forest this year due to cold temperatures. I tapped the trees on March 9th. Early flows were light, but now the sap is flowing well. The figure above shows this year’s sap flow in comparison to the past 3 years. In the left figures, the gray shows the daily temperature range, while the colored bars show the sap volume on the days I collected sap. The right figures show the average sap sugar concentration (top) and cumulative weight of sap collected (middle) and the amount of syrup that could be made from the sap on a per tap basis.
End of Season Summary: Even with a late start it was a good season. The sap was the sweetest it has been over the last four years, with sap sugar content being slightly higher than 2014. Sap volume was moderate. The combination made it the second highest yielding year since I started tapping the trees at Harvard Forest. This is consistent with my prediction that syrup production should be relatively high since 2014 was not a mast year. (More about the relationship between masting and syrup production.) I expect to see more flowers on the trees this spring and more seeds this fall.
